Two-part live online workshop | 6–7 September 2025 | 10:00–13:00 (UK Time)
Cities speak — not just through buildings and infrastructure, but through the digital traces we leave behind. Every geotagged photo, like, and comment carries a fragment of feeling, a glimpse into how people experience urban space.
What if we could collect and map these feelings? What if urban design could engage not only with form and function, but with emotion?
Sentiment Topographies invites participants to explore this hidden layer of the city — one shaped by perception, memory, and mood.
We ask:
What makes a place feel loved, ignored, or misunderstood?
Can we translate shared emotions into spatial insight?
How might designers, artists, and planners work with public sentiment as a material?
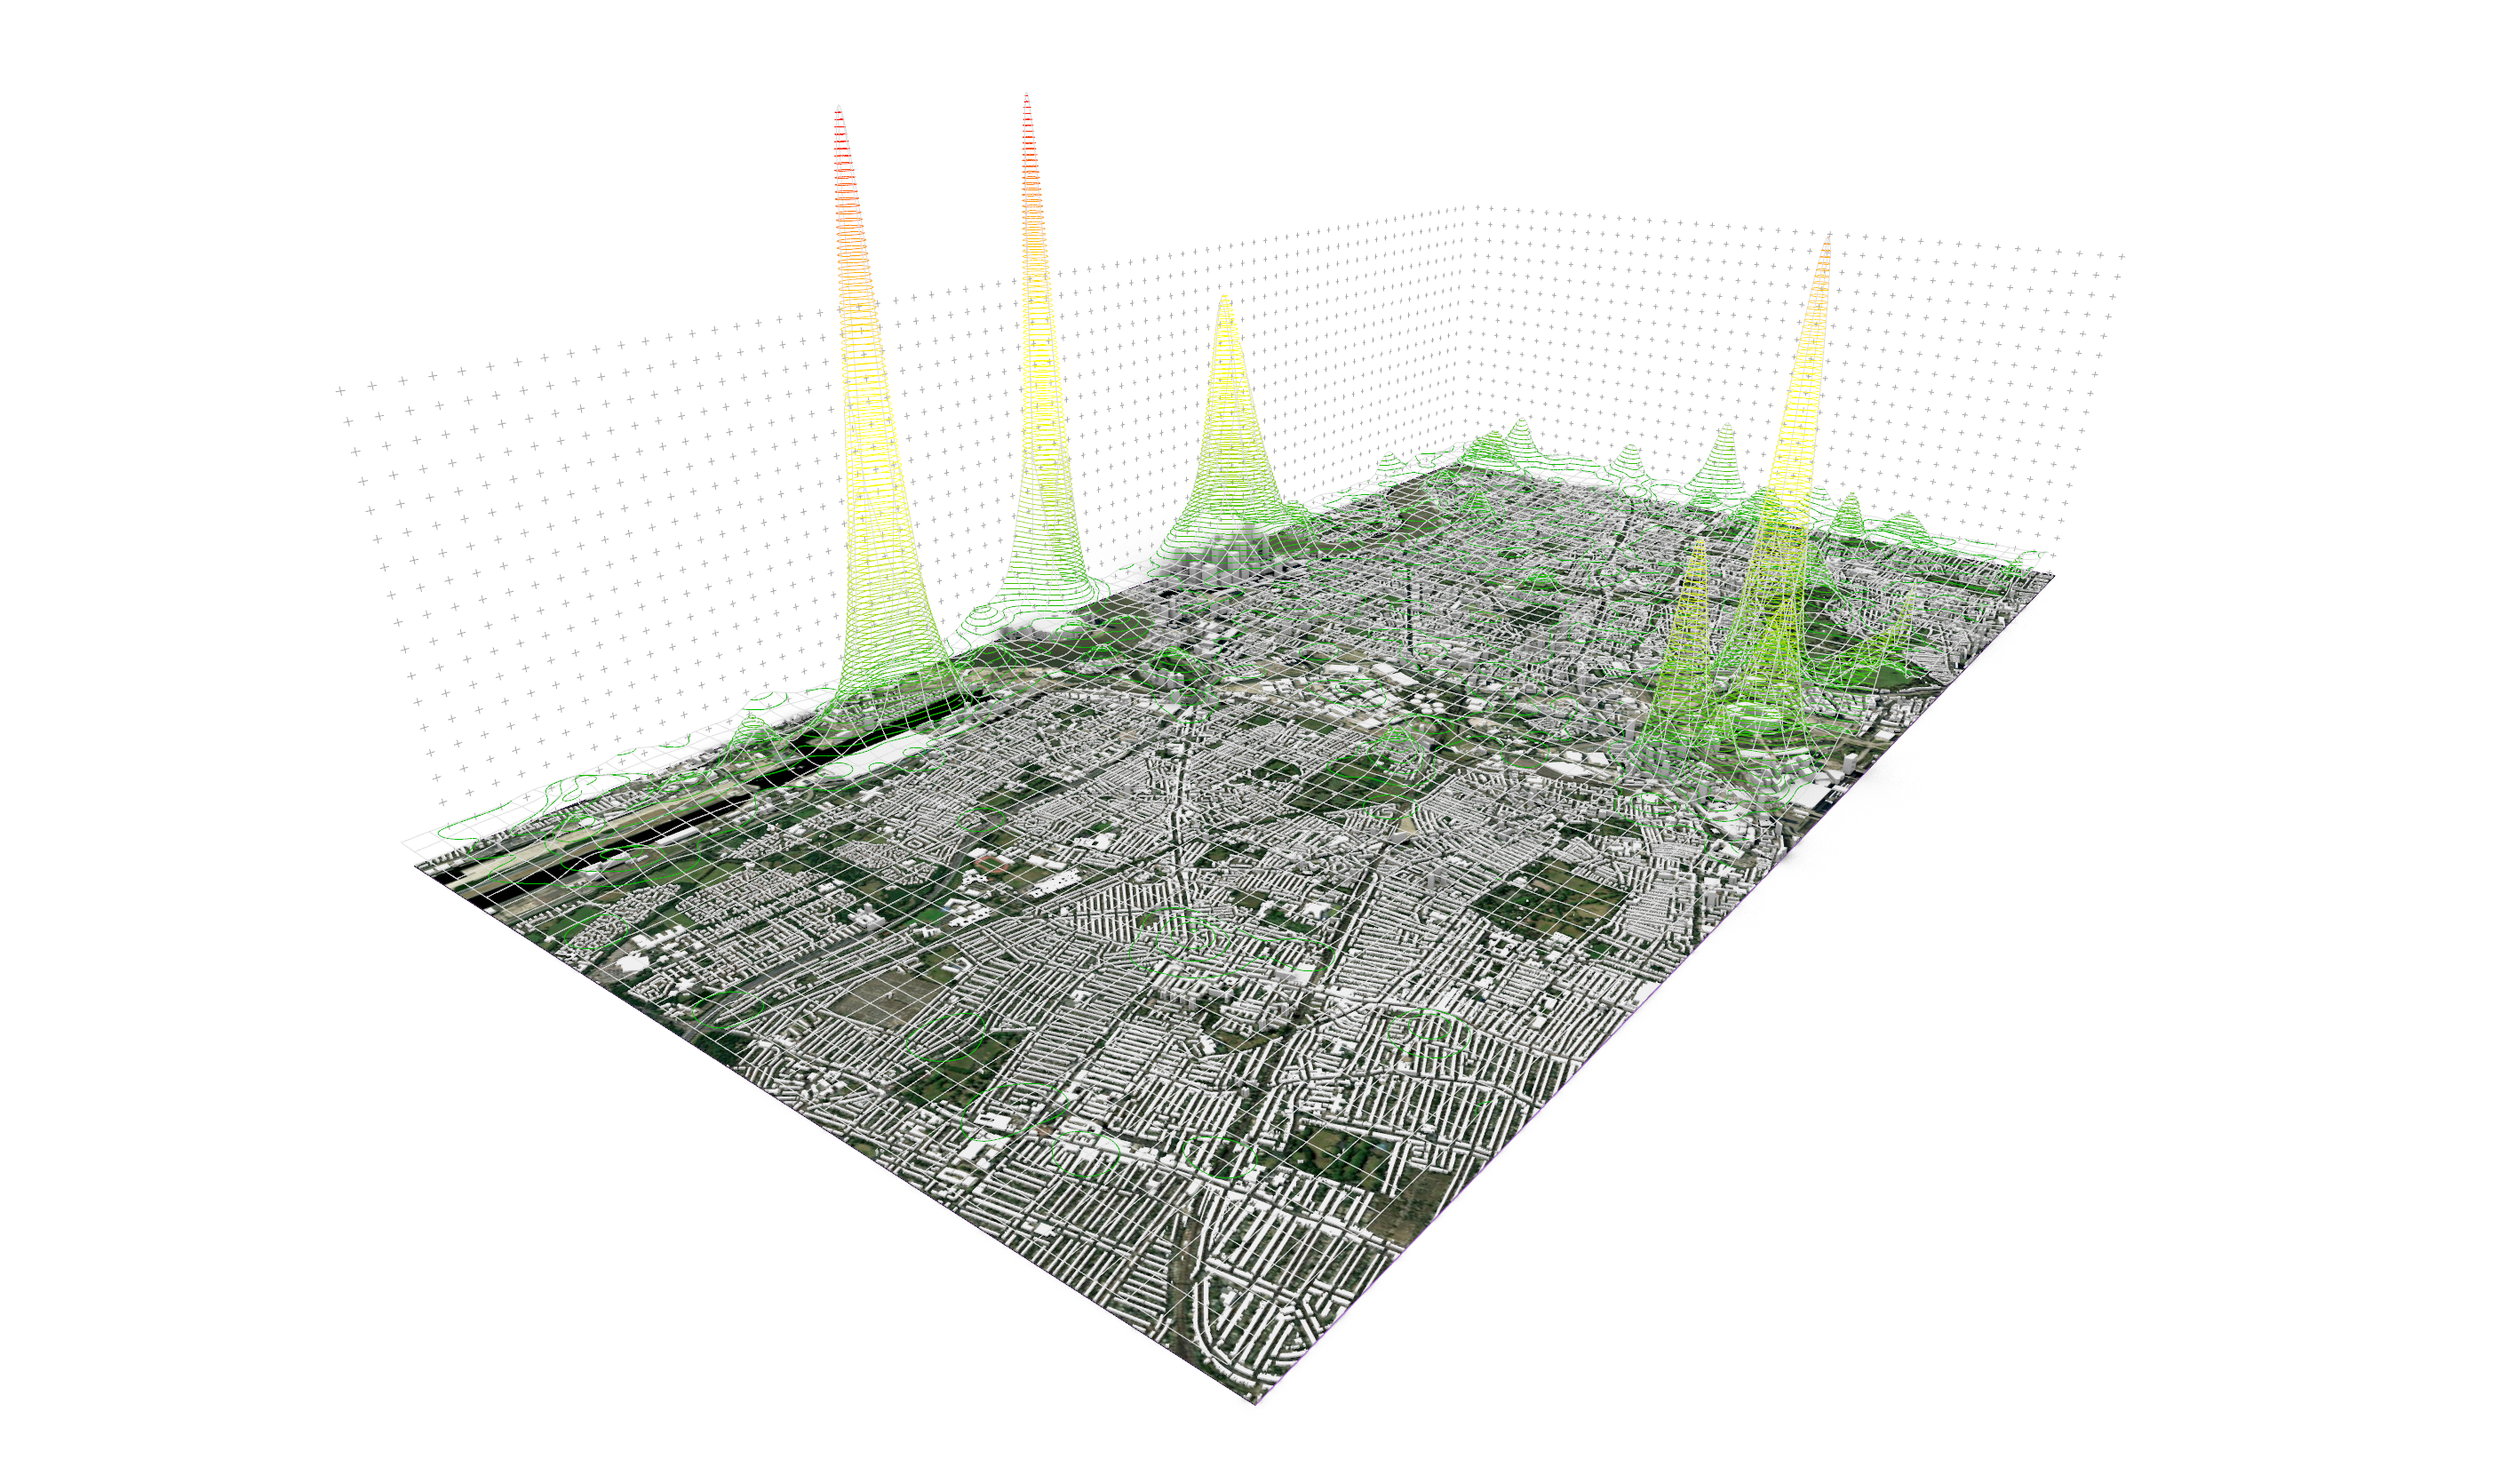
In this hands-on, two-day online workshop, you’ll use data scraped from Flickr — including geotagged images, likes, and comments — and transform it into expressive, data-driven 3D terrains. Through a combination of Python scripting, Grasshopper visualisation, and Illustrator-based refinement, you’ll create visual artefacts that blur the boundaries between emotion, computation, and space.
What You Will Learn
How to query the Flickr API to download geolocated images and metadata
How to extract and score sentiment from user comments and tags using Python (VADER)
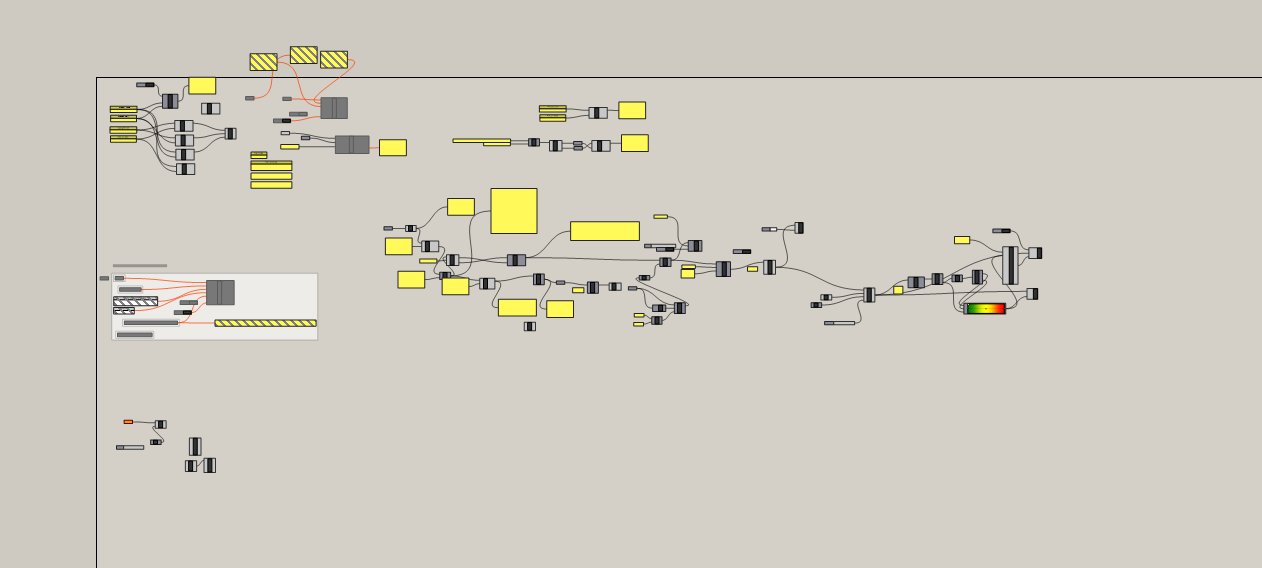
How to overlay and visualize that data as 3D emotional landscapes in Rhino/Grasshopper
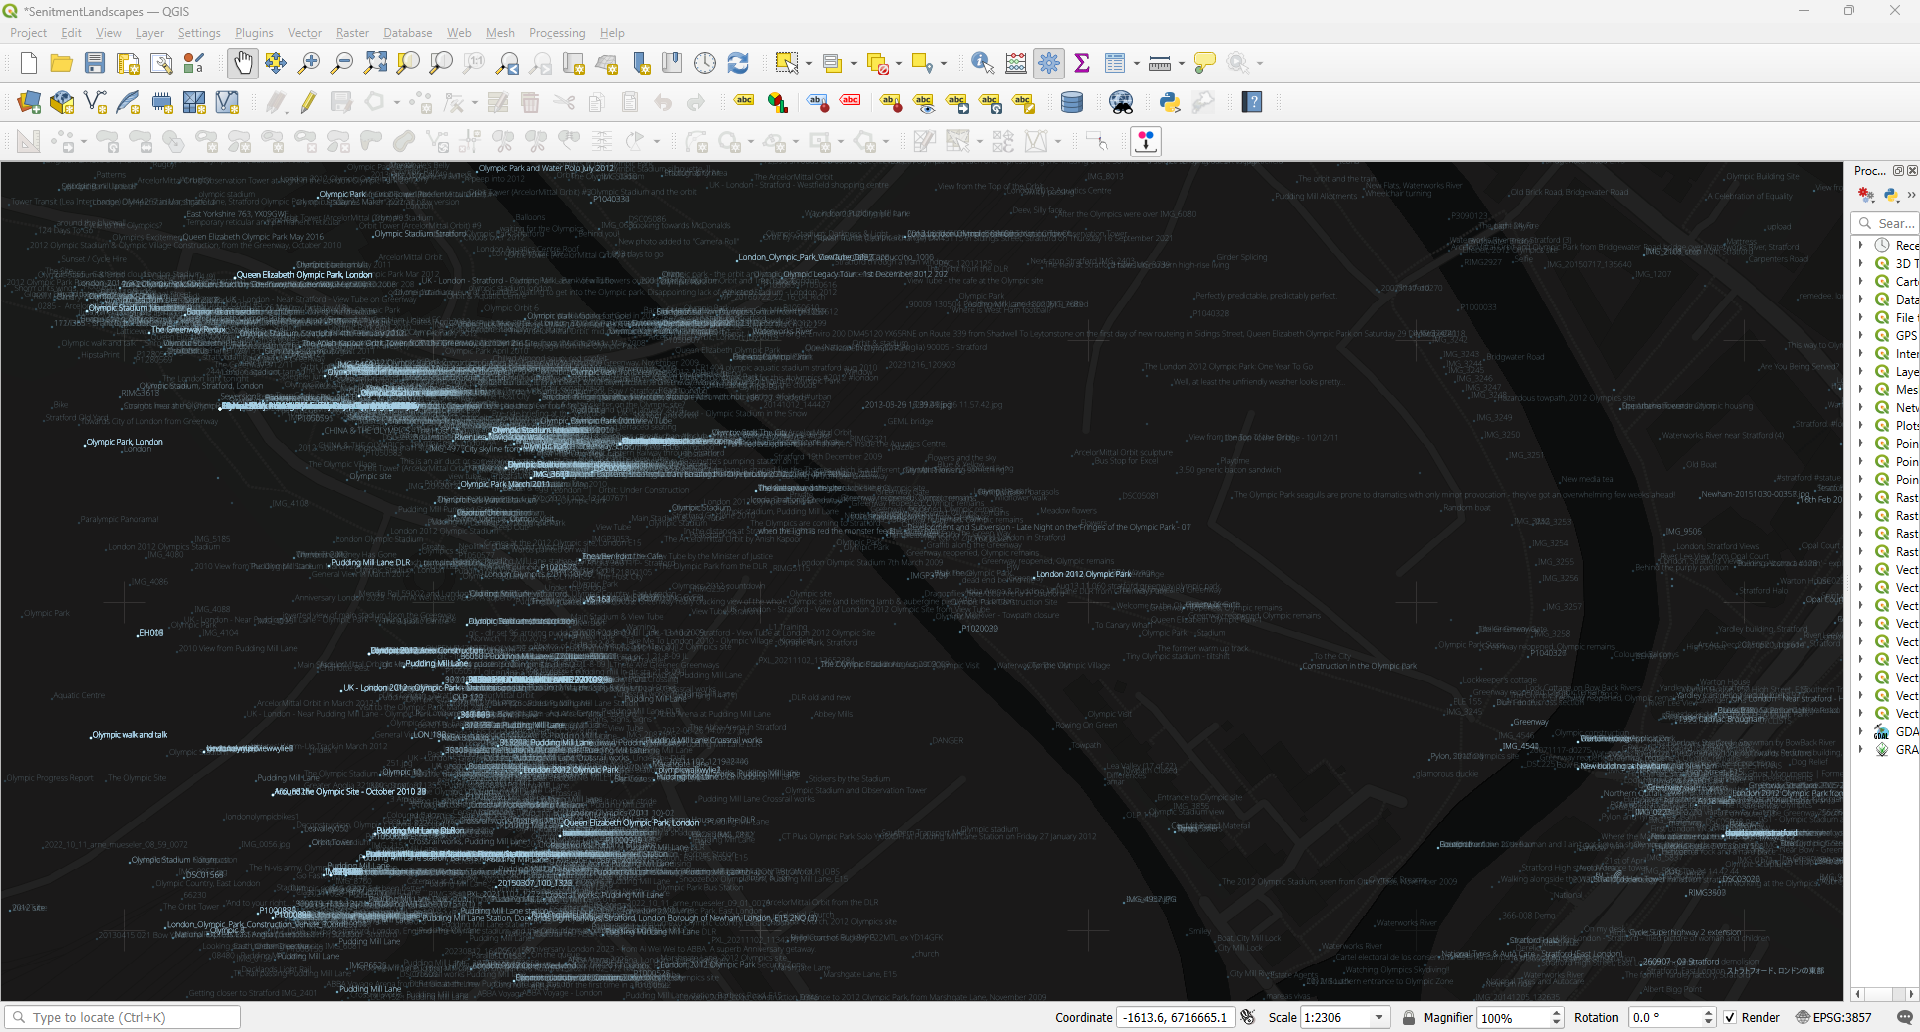
How to work with urban geometry from OpenStreetMap using the Heron plugin
How to export, refine, and communicate results using Adobe Illustrator
How to think critically about digital emotion, perception, and urban form
Session Breakdown
Day 1 — How popular is a place?
Define a geographic bounding box using online tools
Collect image data and likes from Flickr
Import the dataset into Grasshopper
Use like-counts as height to create emotional topographies
Overlay your data onto a real-world 3D city model using Heron and OpenStreetMap
Day 2 — What do people say, and how do they feel?
Extend your dataset to include comments, tags, and titles
Use VADER sentiment analysis to assign emotional scores
Visualize your findings as a Sentiment Terrain — a heatmap, mesh, or field-based representation of urban emotion
Export maps and diagrams for post-production in Adobe Illustrator
Finalize and stylize your visuals in Adobe Illustrator
Who It’s For
This course is ideal for:
Architecture and urban design students
Early-career professionals interested in digital design
Creative technologists and media artists
Anyone curious about spatial storytelling and emotional mapping
No coding (or very little) experience is required — we provide ready-to-use scripts and make use of AI text prompting.
Details
Dates: 6th & 7th September 2025
Time: 10:00–13:00 (UK Time)
Format: Live on Zoom
Language: English
Spots: Limited to 15 participants
Level: Beginner-friendly
What You’ll Need
Operating System: Windows
Software: Rhino & Grasshopper (7 or 8), QGIS, Adobe Illustrator
Accounts: Flickr + Gmail
Pricing
Standard ticket: £150.00
Student and early bird: £120.00
Interested in joining? Register by emailing vincent@flowarchitecture.co.uk
Spaces are limited — first come, first served.